My next project is about image segmentation. From the word itself, this task aims to isolate an object from an image based on the object color. For grayscale images, the process is simple. The only step that will shake your brain is getting the histogram of pixel values of the image. This is followed by checking the threshold (lower and upper limit) values of your region of interest. The last step is binarizing the whole image in such a way that all pixels inside the lower and upper threshold have values equal to 1 and the other pixels outside this are set to 0. To do the final step, use a boolean operator to make the binarized image. Let’s consider the image in Fig 1. As I said before, the hardest part for this case is plotting the histogram. Luckily, Ma’am Soriano (thank you!) gave us the code. That code is so important because it is the main bulk of image processing techniques that utilize histograms. I’ll leave it Fig 2 for future references. Moving on, the histogram of the image in Fig 1 is presented in Fig 3.
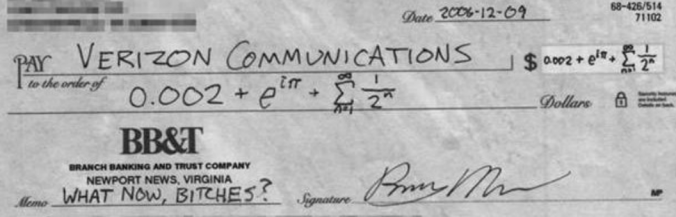
Fig 1. Sample grayscale image
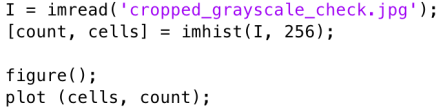
Fig 2. Histogram code
My main interest in Fig 1 is the texts and I want to segment it from the white background. In the histogram (Fig 3), we can see that the pixel values are dominated by the bright spaces in the sample image. What I want to do is to set the pixel values of the background to zero and this time, the boolean operator will do its part.
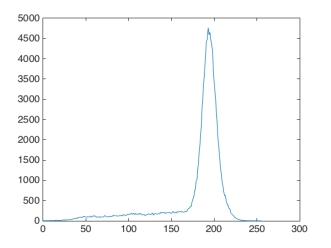
Fig 3. Histogram of Fig 1.
Just perform the code snippet- Im = I
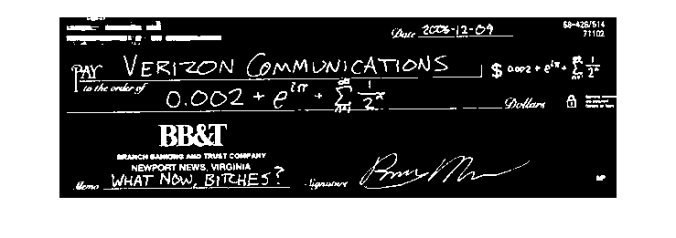
Fig 4. Binarized image of Fig1.
In segmenting colored objects from the image, there are two possible methods: parametric and non-parametric segmentation. I deal mainly with the histogram of the whole image and look which part of it where the color of our object most probably belongs. Therefore, the first step is to crop some portion of our object and this is called the region of interest (ROI). Then, each color channel (R,G, and B) is normalized by dividing the whole matrix by the sum of the three channels (R+G+B). This will result to normalized color channels (r, g, and b). Note that normalized blue color channel is just the difference of 1 and the sum of the remaining two normalized color channels (r+g). Therefore, the number of independent color channels is reduced from 3 to 2. The succeeding processes for each method mentioned earlier will branch out from this point.
For the parametric segmentation, we have to calculate the mean and standard deviation of red and green normalized color channels and assume that the probability distribution function of eacf color follows the gaussian distribution (Eq 1). My test image contains numerous spheres with different colors and my ROI is the red sphere. I displayed it in Fig 5.
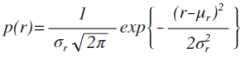 (1)
(1)
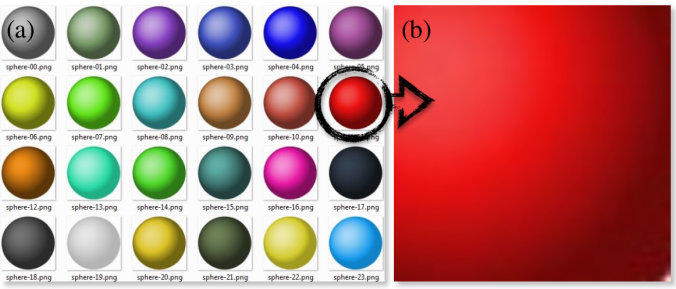
Fig 5. Test image (a) and the chosen ROI (b)
To check if the color of each pixel belongs to the color of the ROI, just implement the joint probability of red and green colors (p(r)p(g)). This will tag a value to one pixel depending on the probability that the color belongs to the ROI. The result (Fig 6.b) is an image in which only the ROI pixels have higher values compared to the other pixels with different color. Therefore, the object is said to be segmented.
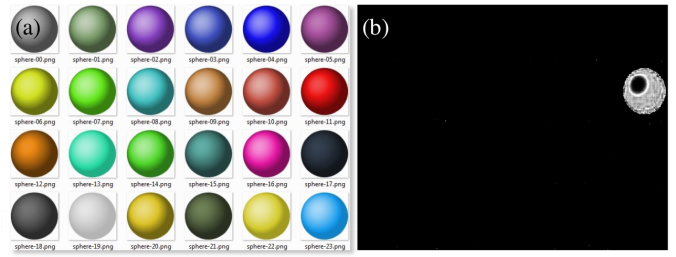
Fig 6. Test image (a) and segmented image using parametric segmentation(b)
The parametric equation I use to segment is given in Eq 2.
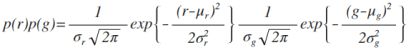 (2)
(2)
The next and final segmentation utilizes the histograms of the ROI and the test image directly and no further calculation is needed. Sounds good right? The process is more direct and lessens the trouble of calculating the mean and standard deviation but for me, the algorithm of this technique is more challenging to construct. Histogram construction is not as intuitive as it seems but more rewarding if you finally understand how it is done. It feels like you are now a true histogram maker.
Following from the normalization step, I need to put all the color values of red and green normalized color channels into one long array. To do this, the pixel values must be binned such that the first half of the bins accommodates the red pixel values while the other half is occupied by the green pixel values. Now, I have to deal with the histogram construction again and plotting it with three color channels is not intuitive. Again, the code for this is given in Fig 7. The for loops counts the number of pixels that falls on a given color value.
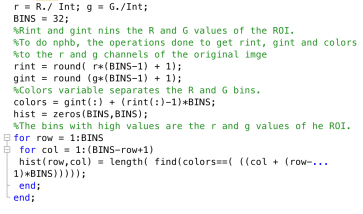
Fig 7. Code snippet for binning of colors.
The next thing to do is to recover the histogram coordinates of the ROI and convert it into the color values. Separate them using the technique of multiplying and adding scheme before. All pixels of the image are given with grayvalues depending on the probability of its initial color which is based on the histogram of the ROI.
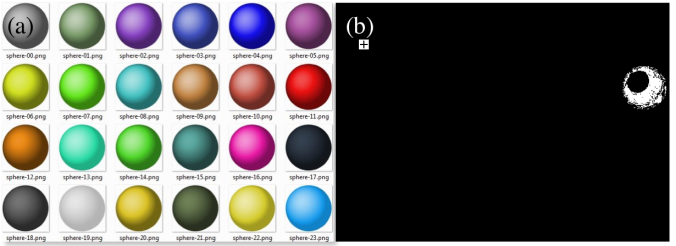
Fig 8. Test image (a) and segmented image using non-parametric segmentation (b)
Both methods are able segment the ROI from the whole image. The direct advantage of non-parametric is the fact that no calculation of mean and standard deviation is needed. It uses the histogram directly to separate the ROI from the original image. This can save some time if you are dealing with hundreds of images to segment with.
I’m done! I was able to demonstrate both methods clearly. I was successful in segmenting a colored ROI from the original image. This activity took me a lot of time and effort to finish. Therefore, I will give my self a 10.
References:
[1] M. Soriano, AP 186 A7 – Image Segmentation. 2016.
[2]https://www.google.com.ph/urlsa=i&rct=j&q=&esrc=s&source=images&cd=&ved=0ahUKEwiQur6EruLQAhWBtI8KHUsDAuMQjxwIAw&url=http%3A%2F%2Fopengameart.org%2Fcontent%2Fcoloredspheres&bvm=bv.140496471,d.c2I&psig=AFQjCNFt8fmPmylbMlZfRelwvuArEy0Vhg&ust=1481209637460827
